Support
Yen weakens as Japan’s producer price growth exceeds market expectations
Japan's Producer Price Index accelerated to 7.1% in October, exceeding market forecasts and weakening the yen against the US dollar.

Japan's annual producer prices climbed to 7.1% in October, beating the 6.5% estimate.
The yen fell by 0.67% against the US dollar, pushing the USD/JPY pair close to the ¥160 threshold.
High energy, high-tech component, and import costs continue to drive producer inflation higher.
Rising 10-year government bond yields reflect growing expectations of tighter central bank policy.
Date: 13 November 2026 (GMT+3)
Can rising producer prices put further pressure on the yen?
According to data released by the Bank of Japan (BoJ), the Producer Price Index (PPI) accelerated from 6.8% in September to 7.1% in October, exceeding analysts' estimates, which had anticipated a deceleration to 6.5%. On a monthly basis, the PPI rose by 0.7%, surpassing the market consensus forecast of 0.3%.
Against this backdrop, Japanese producers have faced mounting price pressures from high energy prices, rising costs for high-tech components, and elevated import expenses as the Japanese yen continues to exhibit weakness.
Despite an underlying contraction in the USD/JPY currency pair over the past three months, the pair has accumulated a year-on-year appreciation of 3%. Crucially, it has oscillated close to the ¥160 threshold in its year-to-date (YTD) performance—a valuation level considered high in a long-term comparison.
In this context, following the BoJ's producer price release, the Japanese yen depreciated by 0.67% against the US dollar, with the USD/JPY pair closing at ¥159.76. This movement was primarily driven by the pressure that higher producer prices exert on the Bank of Japan to reinforce its restrictive monetary policy stance at upcoming meetings. Should the PPI continue to rise, companies may pass these higher costs on to consumers in order to protect their profit margins.
Additionally, following the PPI publication, Japanese 10-year government bond yields have accumulated an increase of approximately 19 basis points, trading at 2.86% as expectations of a more restrictive BoJ stance build. While the Japanese central bank faces a dilemma between weak economic growth and rising inflation, the BoJ has emphasised that its priority is price containment in order to prevent inflation from consolidating above its 2% target. Currently, the Japan's headline inflation stands at 2.1%, although it accumulates five months exhibiting an upward trajectory.
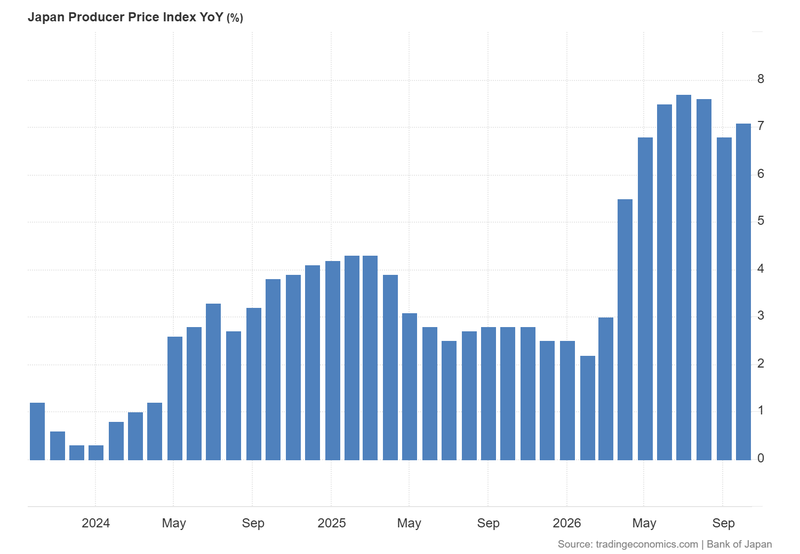
Figure 1. Japan Producer Price Index YoY (2023–2026). Source: Data from the Bank of Japan; chart retrieved via Trading Economics.
Technical analysis of the USD/JPY pair
From a technical perspective, the USD/JPY currency pair exhibits bullish momentum. Key observations include:
- Trend Context: Over a longer-term horizon, the pair maintains a technically bullish market structure, characterised by higher highs and higher lows. Crucially, it is trading above its 50-day, 100-day, and 200-day Simple Moving Averages (SMAs), signalling that underlying upward momentum remains intact.
- Momentum Indicators: The Moving Average Convergence Divergence (MACD) indicator exhibits an upward trajectory alongside a rising histogram, signalling that bullish momentum could persist in the short term. Additionally, the Relative Strength Index (RSI) is trending upwards (currently around the 63 level), reinforcing the likelihood of further short-term bullish impulse as it has yet to signal overbought conditions.
- Resistance Levels: Should short-term bullish momentum continue, immediate resistance is positioned at ¥162.00, where the Volume Profile's Value Area High (VAH) converges with structural resistance. Beyond this technical confluence, a key overhead resistance is situated near ¥164.00.
- Support Levels: Should short-term selling pressure re-emerge, immediate downside support is identified at ¥158.60—a level where the Volume Profile's Point of Control (POC) converges with the 200-day SMA. Beneath this, secondary support lies at ¥156.00, marking a confluence between the 38.2% Fibonacci retracement level and short-term structural support.
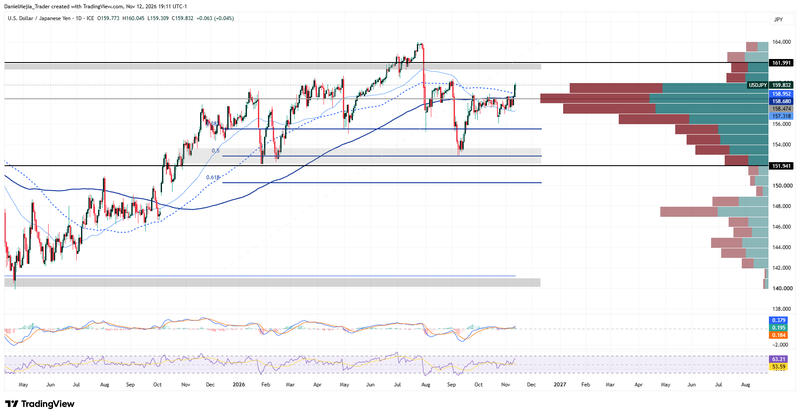
Figure 2. USD/JPY Currency Pair (2025–2026). Source: Intercontinental Exchange (ICE) data; author's analysis via TradingView.