
 Support
Trading Ideas
Get the edge with potential investments and opportunities
Globalisation explained: how it works and affects markets
Globalisation has made economies increasingly interconnected, with trade, investment and technology linking countries and markets around the world. These relationships can shape business activity, supply chains and the way financial markets respond to developments across regions.
25 Sep 2026, 12:12
What are fiscal policy tools and how do they work?
Fiscal policy covers the decisions governments make about spending, taxes and financial support to households. These choices can increase or reduce demand across the economy, with potential effects on growth, inflation, borrowing and government debt.
25 Sep 2026, 11:56
What traders should know about OTE vs Fibonacci
Optimal Trade Entry (OTE) is based on Fibonacci retracement, but it focuses on a defined area rather than a full set of levels. This article explains how OTE works, how Fibonacci differs and why ICT traders use market structure for confirmation.
What is a Judas Swing? Identifying false moves in ICT trading
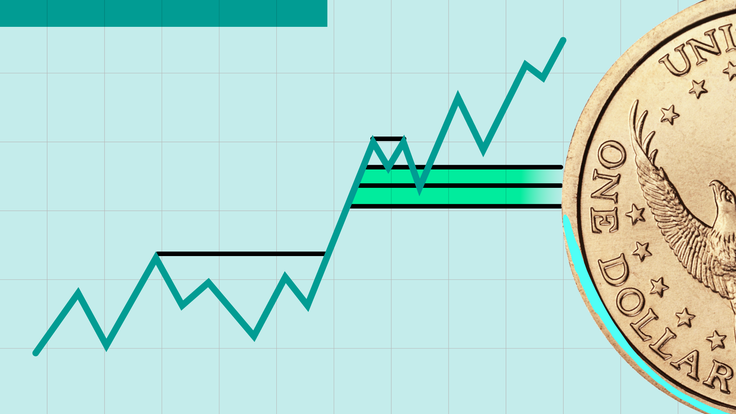
A Judas Swing happens when price moves in one direction at the start of a session before reversing into the real daily trend. This article explains how ICT traders use it to read false moves and liquidity grabs.

Trading false breakouts with the Turtle Soup strategy
The Turtle Soup strategy focuses on failed moves beyond support or resistance. This article explains how traders look for liquidity sweeps, rejection and confirmation before considering a reversal setup.

How to spot trend changes with the Aroon indicator
The Aroon indicator is designed to help traders assess trend direction and possible turning points. This article explains how its 0% to 100% scale and crossover signals can support market analysis.
How inflation influences stocks and investor sentiment
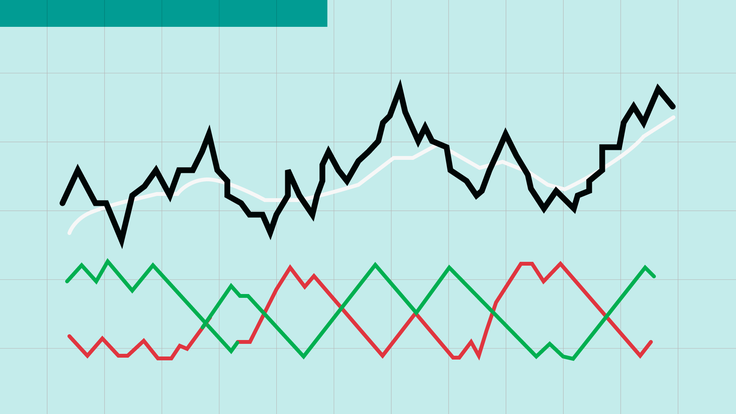
Higher inflation can affect stocks by reducing purchasing power, increasing business costs and changing interest-rate expectations. This article explains how these pressures feed into profits and valuations.

What is the Wyckoff accumulation pattern?
The Wyckoff Accumulation Model is used to analyse how demand can build before a stronger move higher. This article explains the phases of the model and how traders use them to assess market structure.
How internal and external structure work in ICT
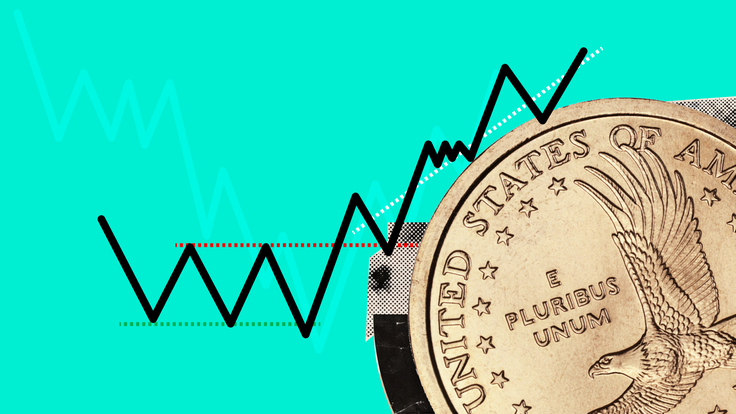
In ICT trading, internal and external structure help traders understand short-term movement and the wider price target. This article shows how they support BOS, FVG and Order Block analysis.
YoY explained: how to calculate and analyse year-over-year change
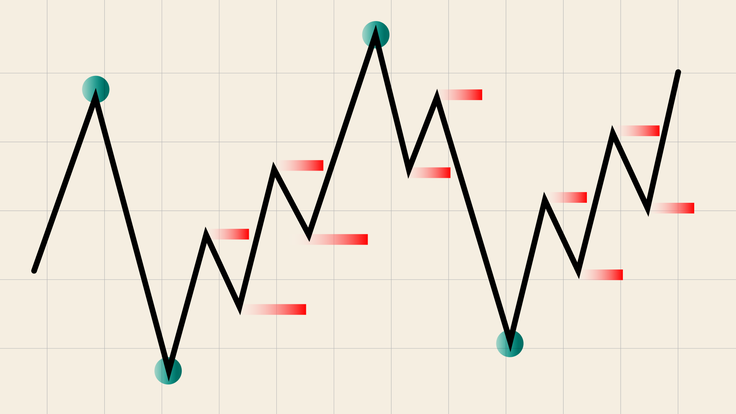
Year-over-year (YoY) shows whether a figure has risen or fallen compared with the equivalent period in the previous year. The measure is frequently used in earnings reports and economic releases to track changes in areas such as company performance, inflation and economic growth.
9 Sep 2026, 11:47