Help
Help Yen strengthens despite Japan’s producer inflation cooling
The Japanese yen appreciated despite cooling producer inflation, as slowing price growth signalled macroeconomic stability.

Japan's producer inflation eased to 6.8% in September driven by moderating energy and manufacturing costs.
Despite Japan’s heavy reliance on energy imports, petroleum and coal prices exhibited a notable deceleration.
The yen rose by 0.18% against the US dollar, closing near ¥158.29 as markets welcomed macroeconomic stability.
Date: 14 October 2026
Why is the yen strengthening despite slowing producer inflation?
According to data released by the Bank of Japan (BoJ), the Japanese Producer Price Inflation eased from 7.6% in August to 6.8% in September, falling below analysts' forecasts of 7.6%. Although producer prices remain elevated, the underlying trend points to a potential inflection point following two consecutive months of deceleration.
An analysis by Trading Economics highlights that the deceleration in Japanese producer inflation was driven primarily by price moderation in petroleum and coal products (which eased from 14.7% in August to 11.5% in September), textiles (slowing to 1.4% from 2.2%), production machinery (moderating from 4.5% to 4.3%), transport equipment (easing to 4.3% from 4.5%), and food and beverages (slowing to 4.2% from 4.3%). This trend is particularly noteworthy given that global energy prices have surged amid persistent geopolitical tensions in the Middle East.
Against this backdrop, the Japanese yen appreciated by 0.18% against the US dollar, with the USD/JPY currency pair closing near ¥158.29. This market reaction suggests that investors viewed the softer PPI print as evidence of broader macroeconomic stability, a welcome signal given Japan’s heavy reliance on energy imports.
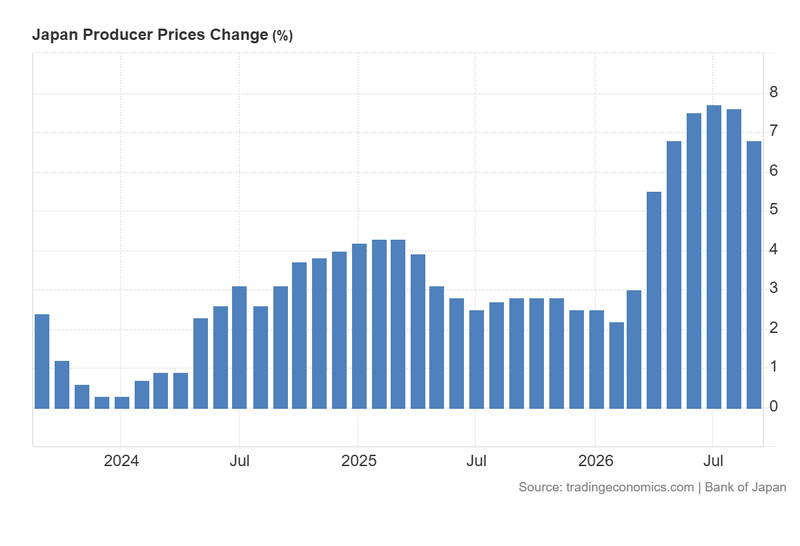
Figure 1. Japan Producer Price Inflation (2023–2026). Source: Data from the Bank of Japan; chart retrieved from Trading Economics.
Technical analysis of the USD/JPY pair
From a technical perspective, the USD/JPY pair is currently undergoing a period of consolidation. Key observations include:
- Trend context: Over the longer term, the pair maintains a technically bullish market structure, characterised by higher highs and higher lows. However, in the short term, the pair is trading within a consolidation range below its 100-day and 200-day Simple Moving Averages (SMAs).
- Resistance levels: Should short-term bullish momentum gather strength, the next significant resistance level lies at ¥159.50, which converges with the Volume Profile’s Point of Control (POC). Beyond this technical zone, key resistance stands near ¥162.00; a breakout above this level could restore the broader bullish trend.
- Support levels: If a short-term bearish contraction develops, the immediate floor is identified at ¥155.50—situated at the 38.2% Fibonacci retracement of the preceding bullish impulse—followed by the ¥153.00 level, which marks a convergence between the 50% Fibonacci retracement and a structural support. A breach of this support zone would significantly increase the likelihood of a deeper market correction.
- Momentum indicators: The Moving Average Convergence Divergence (MACD) and the Relative Strength Index (RSI) both exhibit upward trajectories, pointing to potential short-term bullish momentum. However, the persistence of the consolidation pattern year-to-date signals continued market uncertainty.
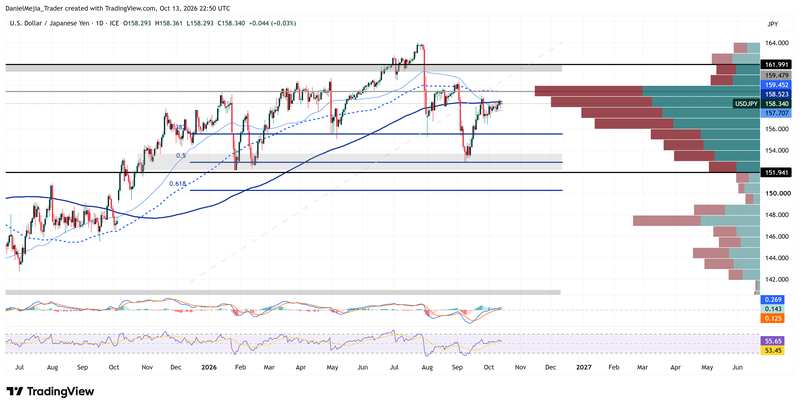
Figure 2. USD/JPY Pair (2025–2026). Source: Data from the Intercontinental Exchange (ICE); author's analysis conducted via TradingView.