Help
Help 
Trading Ideas
Get the edge with potential investments and opportunities
What is globalisation and how does it affect markets?
Globalisation connects economies through trade, investment, technology and information, allowing developments in one country to have effects far beyond its borders. Understanding these connections can help explain changes in supply chains, business conditions and financial markets.
25 Sep 2026, 12:08
Fiscal policy tools explained: spending, taxes and transfers
Fiscal policy is how governments use spending, taxation and transfer payments to influence economic activity. Changes in these tools can affect demand, growth, inflation and government borrowing, making fiscal decisions an important part of the economic outlook.
25 Sep 2026, 11:54
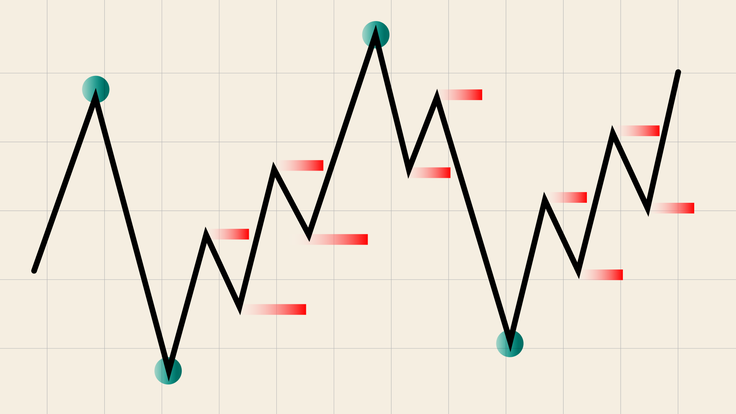
What is the difference between OTE vs Fibonacci
Optimal Trade Entry (OTE) is a specific Fibonacci-based entry model that focuses on the 61.8% to 79% retracement zone. This article explains how OTE differs from standard Fibonacci retracement and why ICT traders use it within a stricter market structure context.
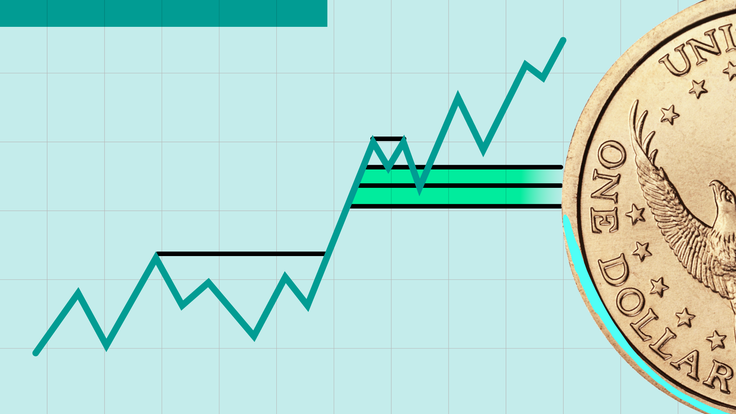
Judas Swing explained: how ICT traders identify the false move before the real trend
A Judas Swing is a false move that often forms at the start of a major trading session. This article explains how ICT traders use it to identify liquidity grabs before the market moves in its real direction.

Turtle Soup explained: How traders use liquidity sweeps to catch false breakouts
The Turtle Soup strategy focuses on false breakouts, where price briefly moves beyond a key level before reversing. This article explains how traders use liquidity sweeps, rejection and range re-entry to identify potential reversal setups.

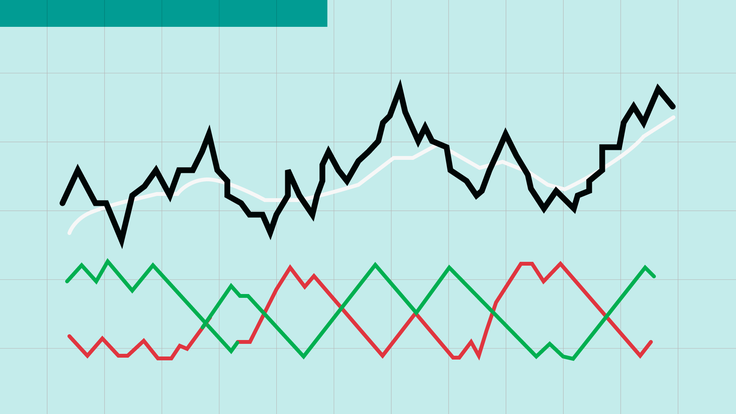
Aroon indicator guide: spot trend changes in trading
The Aroon indicator measures the time between recent highs and lows on a 0% to 100% scale. This article explains how traders use it to identify trends, consolidation and potential reversals.
How inflation affects stocks: Why prices, interest rates, and profits all matter
Inflation can change how consumers spend, how much businesses pay and how investors value future earnings. This article explains why prices, rates and profits all matter for stocks.

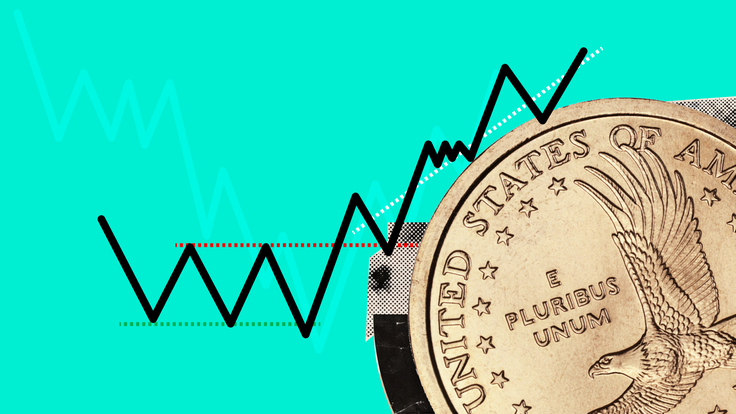
Wyckoff accumulation pattern explained for traders
The Wyckoff Accumulation Model is a long-standing technical analysis theory that explains how major market participants may gradually build positions before a bullish trend develops. This article explains how traders identify accumulation phases, supply absorption and confirmation signals.
Infrastructure investing: key factors and market drivers
Infrastructure investing focuses on essential assets that support everyday economic activity, from utilities and transport to energy and digital networks. This article explains how demand, cash flows, inflation links and market access shape the sector.

Difference between internal and external structure in ICT
Internal and external structure are key concepts in ICT trading because they help explain current price movement and wider direction. This article shows how they connect BOS, Fair Value Gaps and Order Blocks.